Reports
The same data over a window, summarised and exportable
Ctrl K
The historical counterpart to Live Sessions: the same data over a chosen window, summarised into charts you can hand to someone who was not there.
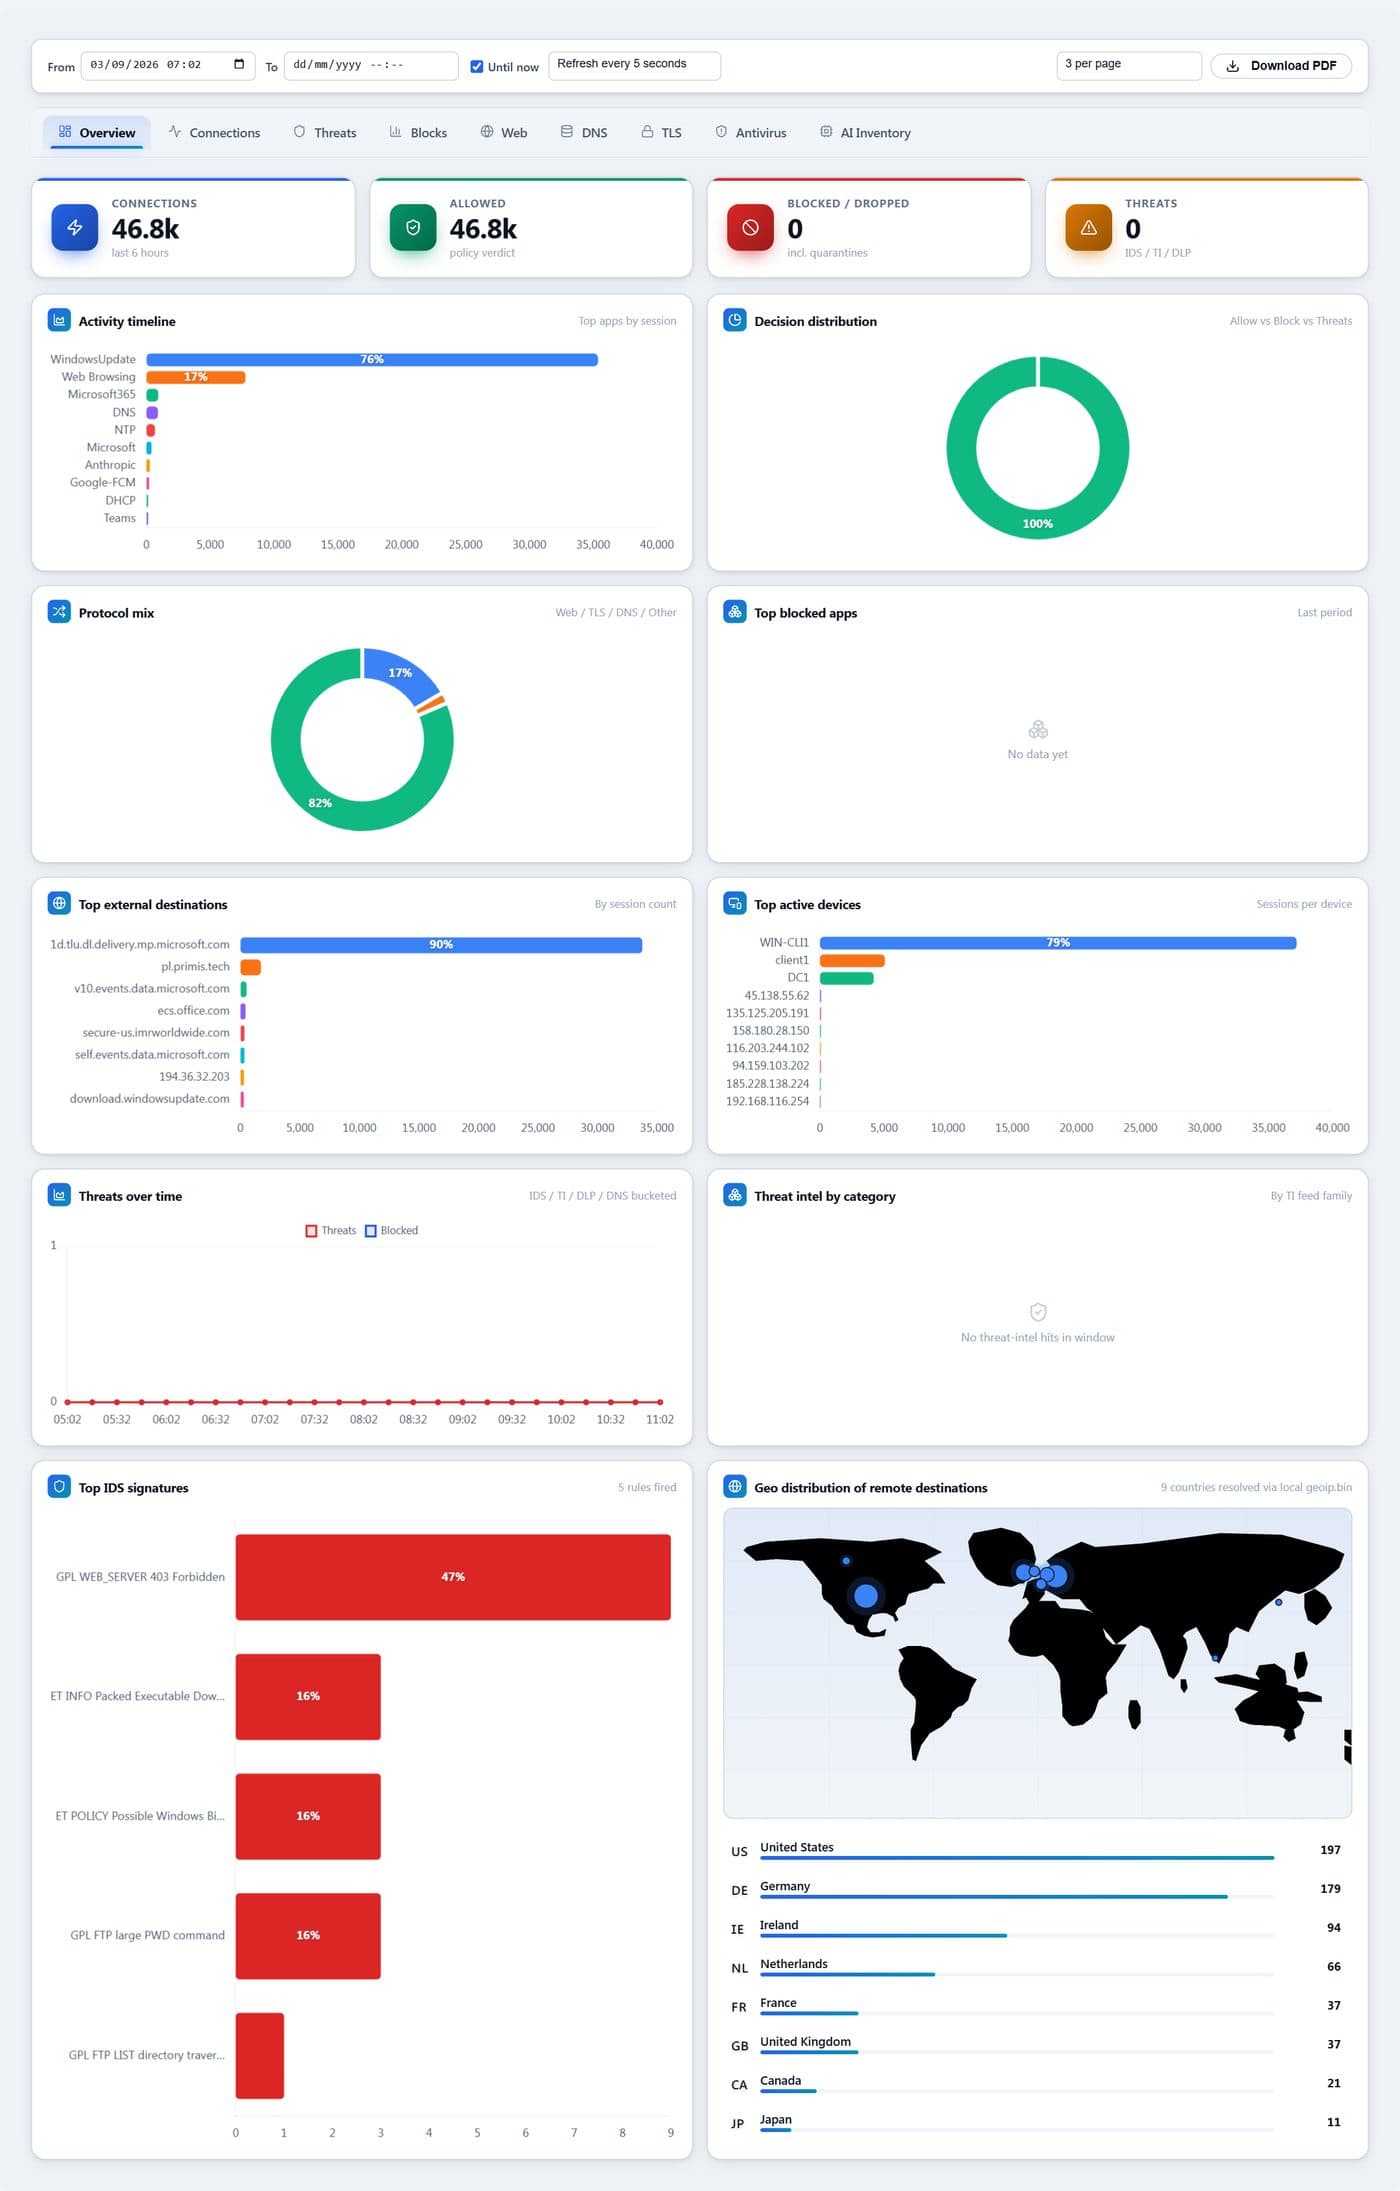
- 1
- 2
- 3
- 4
- 5
- 6
- 7
| # | Control | What it does · how · why |
|---|---|---|
| 1 | From / Totext | The reporting window. Everything below recalculates when it changes. |
| 2 | Until nowtoggle | Keeps the window ending at the present moment and refreshes on the interval beside it — a live report rather than a fixed one. |
| 3 | Refresh interval · rows per pageselect | How often an open report re-reads, and how much detail each table shows. |
| 4 | Download PDFbutton | Renders the current tab and window to a PDF — the deliverable for a monthly review. |
| 5 | Tabsgroup | Overview, Connections, Threats, Blocks, Web, DNS, TLS, Antivirus and AI Inventory. Overview is the executive summary; the rest drill into one dimension. |
| 6 | Headline countersgroup | Connections, allowed, blocked or dropped, and threats for the window — the four numbers that answer “was it a quiet period?” |
| 7 | Chartsgroup | Activity over time, decision distribution, protocol mix, top blocked applications, top destinations, top devices, threats over time, threat intel by category, top IDS signatures and a geographic distribution of destinations. |