Dashboard
Posture, top talkers and appliance health at a glance
Ctrl K
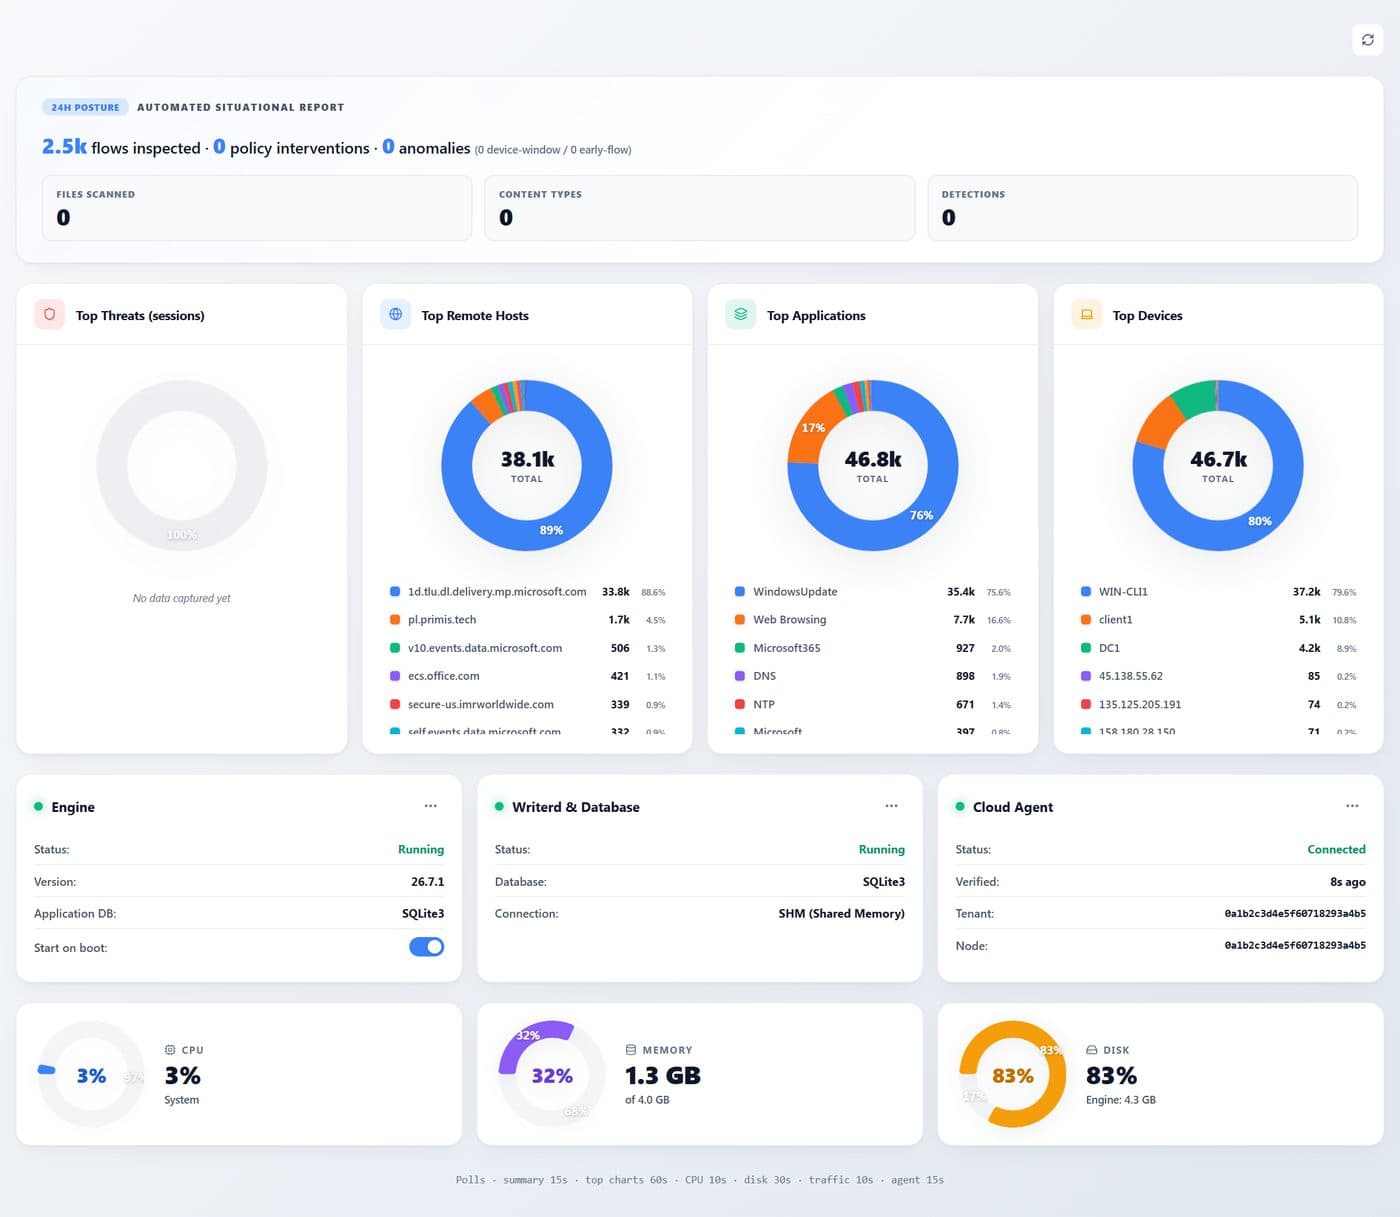
The 24-hour posture of the appliance on one screen: what was inspected, what the policies did about it, and whether the machine underneath is healthy.
- 1
- 2
- 3
- 4
- 5
- 6
- 7
- 8
- 9
- 10
| # | Control | What it does · how · why |
|---|---|---|
| 1 | 24-hour posturegroup | Flows inspected, policy interventions and anomalies for the last day. Interventions at zero with flows in the thousands means the engine is watching and nothing has tripped a rule — the normal state. |
| 2 | Content inspectiongroup | Files scanned, distinct content types seen and detections raised. Zeros here with file scanning enabled mean no scannable transfer happened, not that scanning is broken. |
| 3 | Top Threatsgroup | Sessions that matched a threat source, by share. Empty is what a healthy network looks like. |
| 4 | Top Remote Hostsgroup | Where traffic goes. A destination you do not recognise holding a large share is worth following into Live Sessions. |
| 5 | Top Applicationsgroup | What the classifier identified. Check this before writing App Controls rules — block what is actually present, not what you assume is. |
| 6 | Top Devicesgroup | Which clients generate the traffic. One device dominating is usually a backup, an update run, or a problem. |
| 7 | Enginegroup | The datapath: status, version, database and whether it starts on boot. Running with a version is healthy; anything else means traffic is not being inspected. |
| 8 | Writerd & Databasegroup | The recording pipeline. If it stops, enforcement continues but Live Sessions and Reports go quiet — which is easy to mistake for a quiet network. |
| 9 | Cloud Agentgroup | The console link: connected or not, when it was last verified, and which tenant and node it claims. A stale verification time is the first sign of a broken link. |
| 10 | CPU · Memory · Diskgroup | Appliance resources. Disk deserves the most attention — when it fills, recording stops before enforcement does. |